
This case study comes from a steel machining facility. The machine is used to mill steel poles and give them a nice smooth finish.
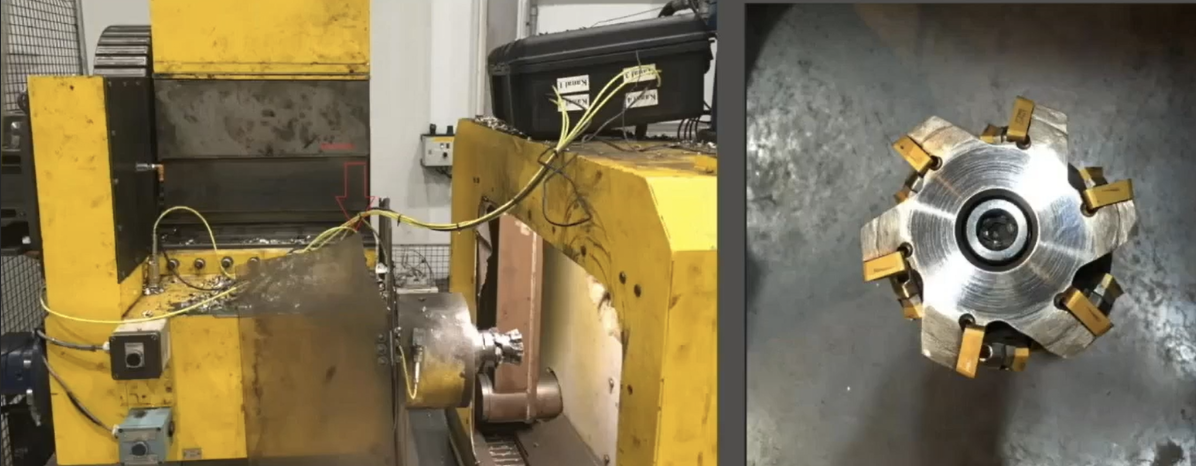
Figure 1: Steel milling machine
We were using a portable, one of our first-generation online systems in the Intellinova series. It multiplexed through the various channels. The transducer is mounted at the outboard bearing side.
The milling head itself has six cutting bits and typically runs at 995 RPM, giving us plenty of speed to work with the initial results.
The readings were low resolution on the first run, as it was an older system. The readings shown in Figure 2 were done with 20 orders and 800 lines of resolution, and there are 51.2 samples.
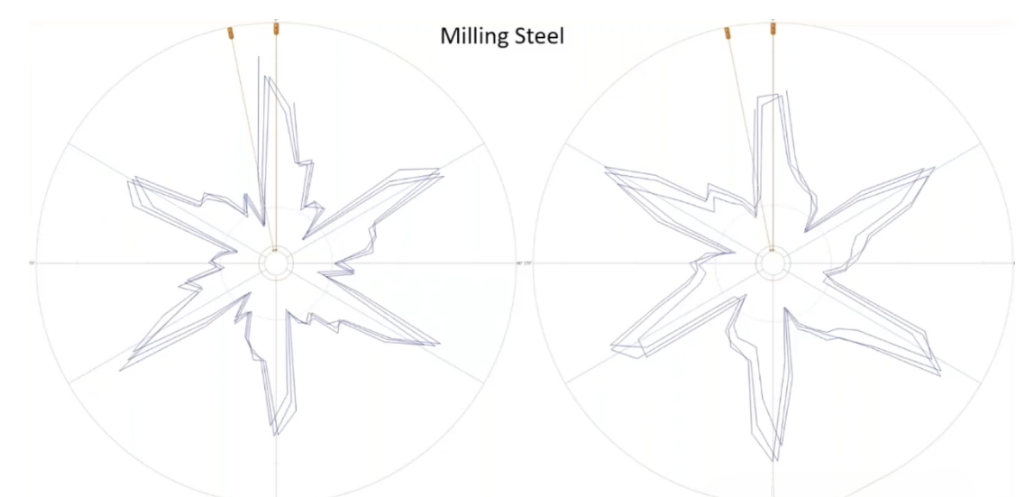
Figure 2: Low-resolution readings
We can see six peaks, but the resolution was insufficient. We made some adjustments and increased the resolution. We also added a tachometer to enable Order Tracking. The resolution was increased by ten times, and there are 200 orders in 512 samples.

Figure 3: Readings with increased resolution and Order Tracking
Under each knife bit, we can now see between 12 and 20 different peaks. This is due to the scraping. When the bit cuts the metal, there is a bit of dragging or cracking, which causes the multiple peaks per cutting bit.
But of the six main peaks, one is lower than the rest. It may not be adjusted correctly, making the same pass. This is likely to affect the mill face and the fine cut edge.
Figure 4 shows a time signal from the samples we took, starting from the 9 second mark and continuing to the 13 second mark. Our measurements take around .03 or .05 seconds, and we measured during the peak of the time signal cut through the most amplitude.

Figure 4: Time signal
Figure 5 shows a microscopic view of the cutting action, so you can see the splitting and cracking effect. We believe that caused the multiple peaks per bit pass.
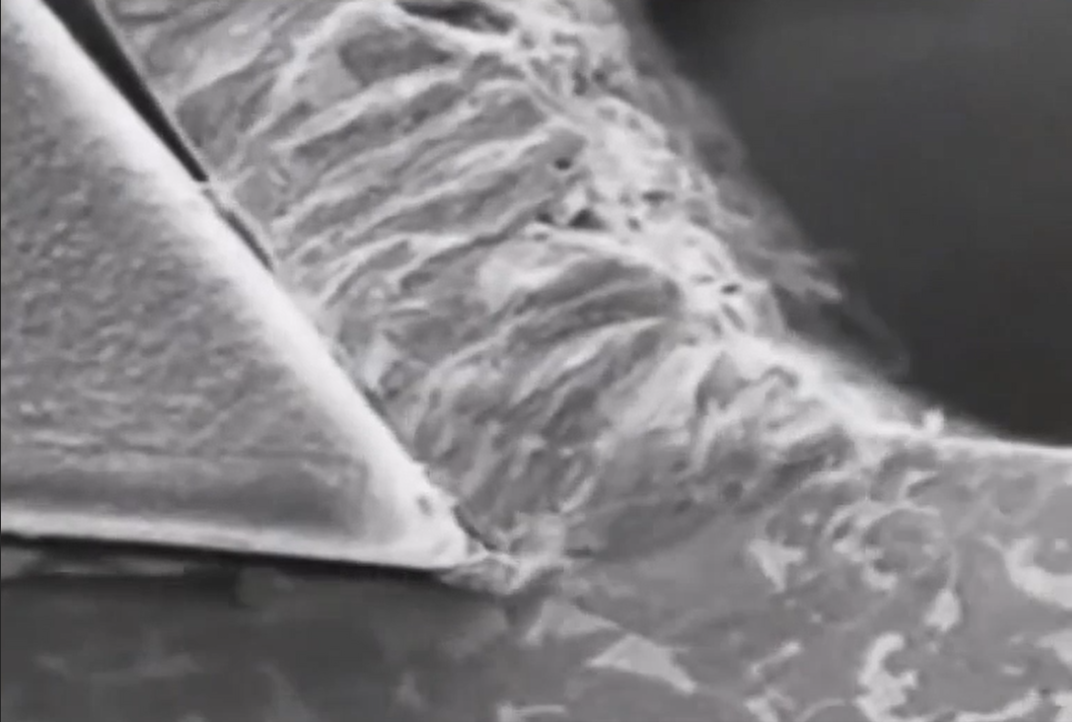
Figure 5: Microscopic view
We also saw cracking and splitting on the edges of actual chips from the process at the facility. The HD technologies we use are sensitive enough to detect these issues.

Figure 6: Cracked chips
We saw an anomaly in the most recent readings from this application. There should be six peaks, but there are only five. This is a clear representation of a broken or missing cutting bit.

Figure 7: Most recent readings
You can also see that the peaks representing the preceding and proceeding bit are larger, representing extra load, as they are performing extra work to compensate for the missing bit. This would obviously impact the quality of the product.
So the mill was stopped and those bits were adjusted.
