
Introduction
This case study describes the online condition monitoring of a drive motor/gearbox in a plant of one of the largest car manufacturers in the UK and around the world.
In this factory, SPM Instrument UK have installed over seventy Intellinova Compact units which are networked throughout the plant. The analysis and diagnostics software Condmaster Ruby 2016 is installed on a server accessible from the main control room. SPM Instrument UK carries out a weekly remote service login and provides monthly reports to support the system and maintenance engineers. On a weekly basis, the automotive engineers are informed of any system alarms, which they investigate during production stops (break times). The maintenance engineers have completed the first stage of SPM training to take ownership of the system.
Conclusion and summary
Following the replacement of the drive, as advised in the SPM report, the shock pulse and vibration measurements dropped to satisfactory levels. We have tried numerous measurement setups and the current setup suits this type of stop/start machine the best. Due to time constraints, the engineers do not have time to replace individual bearings, and so the full motor and gearbox drive are replaced as one.
Application description
The drives in this case study are part of an assembly line conveyor system that transports the chassis of the cars through the plant on platforms (skillets) serving as moving workstations, through the various stages of assembly.
The painted car body arrives at the assembly line from the paint shop. In the assembly line, the body frame receives its interior and exterior trims, after which it is joined (“married”) with the chassis in the Marriage area.
The motors run at 2300 RPM and the helical bevel gearboxes between 6 to 18 RPM.
Three 44010 type shock pulse transducers are installed on the motor NDE, DE, and gearbox output bearings, respectively. One SLD 334S-G vibration accelerometer is installed on the gearbox input.
Image 1. Assembly line drive.

The speed is taken on the output wheel on another drive, running in parallel on the same skillet.
The drive in question is located in the final part of the process where the vehicles are being made. The skillet (pallet) is driven by the motor-gearbox, which only moves in short time cycles. The process is controlled by a number of PLCs. Each painted body is assigned a carrier to firstly take the painted body around the factory to be married with the chassis which is produced in this area. Once the wheels have been assembled, the skillet transports the car to points where various parts of the trim is added, either by robots or by manual operators. The skillet is moved around the track by a number of these assembly drive wheels (located on the output of the gearbox in Image 1.)
Shock pulse HD is used to detect early signs of bearing damage, so the Motor NDE, DE, and Gearbox output are monitored. For SPM HD, it is essential to have the accurate speed and shaft diameter to set alarm levels so, therefore, a proximity switch is also used. Vibration measurements are also taken on the gearbox with an Fmax of 1000 Hz, 1600 lines to reduce the time required to complete measurement during the short time cycle.
Due to the nature of this process starting and stopping every 6-8 seconds, the initial inertia of the start and clanging to a stop can cause problems with the measurements; therefore, post triggers were added.
The below flow chart briefly illustrates the process of post triggering. When parameters are met as described below, the user can specify the delay for measurements to be taken.
Figure 1. How the post trigger works

The aim is to avoid large impacts during measurement, as this causes a ski-slope effect in the time signal and spectrum (see Figure 2 below).
The below picture shows the effect of the reading before a trigger was added.
The measurement was not triggered; therefore, the reading was taken at a time towards the end of the cycle. The time signal shows that at this point, the machine has stopped and is not taking data, thus resulting in a ski-slope measurement.
Figure 2. Initial large impacts in the time domain signal causing ski slope in the spectrum

Background
At the time of writing, SPM Instrument UK has been involved in implementing condition monitoring in Final Assembly at this plant for nine years, with a number of portable instruments supplied initially. Due to the worldwide demand for this make of car, productivity demands on the plant have increased significantly. Breakdowns are therefore very costly and time is critical. In the Final Assembly 1 area, SPM has installed seventy-three Intellinova Compact units which are connected to the plant network and link back to the maintenance office via Ethernet to the Condmaster Ruby software. Initially, SPM carried out a service on these measuring points unaccompanied by plant maintenance engineers. In 2018, two principal engineers were assigned to start overseeing the system and take ownership. Since then, more engineers have undergone training, and the system will start working according to SPM recommendations in 2019.
The assembly line drives are moving the ”final piece of the puzzle” when the car is nearly completed. A failure of these drives is very costly. Based on the condition measurements, SPM predicts when failures are about to occur, giving the engineers time to carry out the necessary maintenance on weekends when no production takes place.
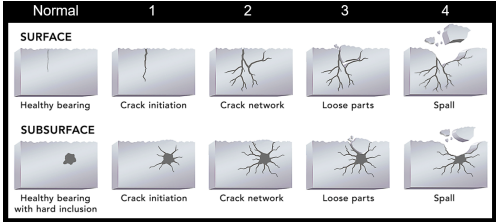
The below chart shows the four stages of bearing failure. SPM condition monitoring systems are able to detect crack initiation (stage 1 in the bearing failure process). Due to the fact that we are able to detect sub-surface cracks, there has been some negative feedback from the engineers replacing these, saying that there were no visible signs of damage when the bearings were sent away for inspection. Through training and after speaking to the engineers at the automotive plant at length, we have reached a conclusion that it is better to change the bearing before the damage deteriorates to save time and money, thus avoiding the risk of costly failure.
Figure 3. The four stages of bearing failure
System setup
Measuring equipment
The motors are very small and there is limited space for transducer installation. The standard 44000 shock pulse transducer, therefore, is not an option. The 44010 glue-on transducers are significantly smaller and are thus used on the motor NDE, DE and gearbox output. Glue-on versions of the SOLID vibration transducers are also used on the gearbox. Throughout the Chassis & Glazing lines, Intellinova Compact units are used. The readings are transferred to a central PC in the Engineering office via Ethernet cable.
Figure 4. Intellinova Compact system overview for the chassis assembly line drive motors.

Measuring point types and locations
- Motor NDE: Shock pulse transducer 44010
- Motor DE: Shock pulse transducer 44010
- Gearbox RPM Proximity Switch
- Gearbox Vibration transducer SLD334sg
- Output shaft (bull wheel) Shock pulse transducer 44010
Image 2. Transducer positions on the assembly line drives.

Measuring technique
The SPM HD shock pulse technology with the 44010 transducers is used to monitor the bearings. The SPM HD Expert module in Condmaster is used to determine the strength and source of the signal, and to determine if triggers are set to the correct level.
Velocity and acceleration levels are measured on the gearbox, with acceleration levels being more effective at looking at the higher-frequency impacts of the gears.
Shock pulses are short-lived elastic waves. SPM HD enables us to detect the deterioration of lubricant in a bearing and very early signs of bearing damage (crack initiation), giving the maximum prewarning time for any maintenance that needs to be carried out.
The below picture illustrates how these signals are transmitted through the bearing. In the below case, the crack network has increased, therefore we would expect to see high shock pulses. When more details are added to the measuring system, e.g, exact speed and bearing numbers, we are able to filter out non-relevant signals.
Figure 5. When the rolling elements pass over the crack network, weak elastic waves are emitted because small surface irregularities collide with the loose parts.

Condmaster setup
Vibration measurement
Below is the vibration setup in the Condmaster analysis and diagnostics software. As can be seen, 1000 Hz fmax and 1600 lines are used with a 50% average overlap. The RPM factor is increased by over 200x from where the proximity switch is located on the output wheel. Measurements are taken every four hours, as we have extended the time taken due to an adequate amount of historical data taken. A post trigger level is set to when the readings reach 0.2 mm/s, at which point the measurement delays for 1-2 seconds. The Max trigger window is set to 10 seconds, though this can be increased or decreased depending on the results.
We have tried various settings for a number of months and after discussions with the automotive engineers we agreed that these would be best for most measuring points in the database.
Image 3. Setup of vibration measurement assignment in Condmaster.

Image 4. Setup of vibration measurement assignment in Condmaster, continued

SPM HD measurement
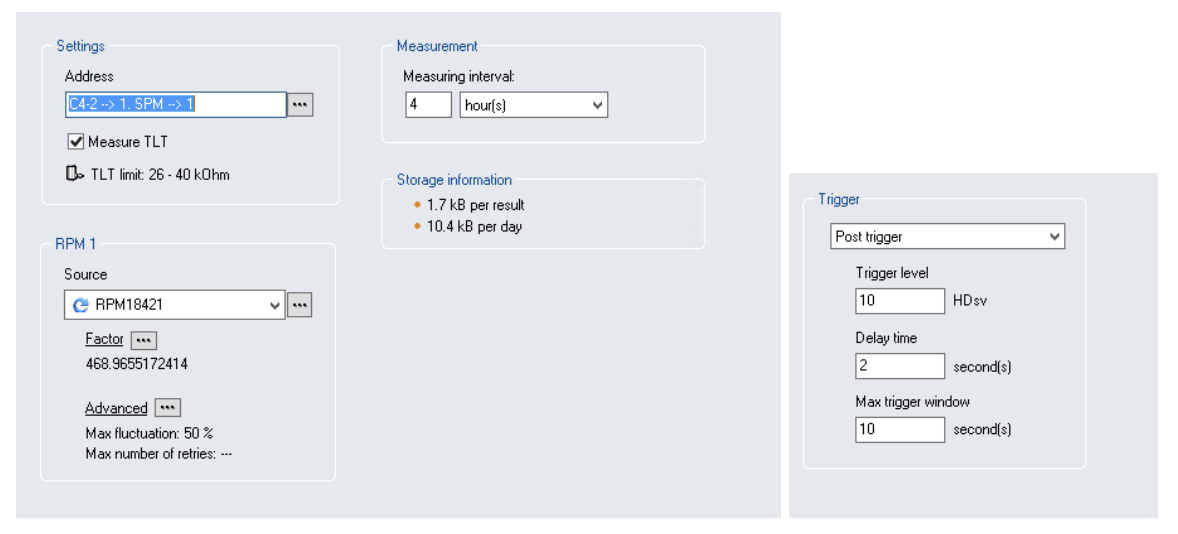
The settings for the SPM HD measuring assignment are as below. The shaft diameter is set to 25 mm and the Measuring time to 10 revolutions, with Upper frequency set to 100 orders and 800 lines. No extra settings were used as cycle time is too short. The Measuring interval is set to every 2 hours with the RPM factor set at over 200 from the proximity switch. The post trigger is set to 10 HDsv, with a delay time of 2 seconds and a Max trigger window of 10 seconds.
The delay time is essential for good, consistent readings as the initial inertia caused by the drive starting needs to be taken into account. On some drives, this delay time has been set to 2-3 seconds.
The Max trigger window is set to 10 seconds, which is enough time for this application to meet the requirements set by the measuring assignment. We have been trying out a number of settings for the post trigger over a good year and it has been decided that these settings are best suited to this particular application.
Image 5. Setup of SPM HD measurement assignment in Condmaster.
Special circumstances influencing measurements
Figure 6. Assembly line working principle.

The above picture illustrates the process moving from left to right. The drives are connected to wheels, which move the skillets along the track. The car is on the skillet and once a number of parts have been fitted, the skillet moves on to the next step process of the process.
Skillets arriving at the drives cause massive impacts under intense strain, affecting the shock pulse and vibration values.
Skillets being transferred across to different sections with chains clattering increase HDm/HDc levels.
As previously explained, multiplexing is not ideal for these short-cycle measurements.
The manufacturing lines are not continuously running, and the starting and stopping of the lines means that the system cannot complete measurements across the drives.
Case descriptions
Case #1
The below graph shows acceleration measurements on a bevel gearbox driving an assembly line wheel.
These acceleration readings were raised on this measuring point at times since July 2017. The engineers replaced the entire unit in April, 2018, and since then, the readings reduced to acceptable levels. The spectrum and time signal verify that the measurements are true, as we are getting a sinusoidal wave from start to finish and all transducers have been checked to have no faults.
Because the triggers were initially not set up correctly, there were a lot of spurious measurements so we had to trust the overall trend to get an idea of the mechanical condition. There were, therefore, a number of readings low, then high as highlighted before July 2017, when only one measurement per month was saved due to the large size of the database.
When the unit was replaced, the readings dropped significantly; from around 3.5 m/s² to 0.5 m/s² as can be seen below.
Image 6. Overall acceleration trend showing significant reduction of the levels after unit replacement.

Case #2
This motor has shown high shock pulse levels in intermittent periods throughout the entire period of measurement. After the unit was changed in April 2018, the readings have remained on acceptable levels.
Image 7. SPM HD Trend and spectrum before maintenance
Case #3
The readings showed a steady rise, which was reported to the customer by SPM six months prior to replacement of the unit as per our recommendations. The readings have since remained on acceptable levels.
Image 8. SPM HD Trend showing a clear amplitude reduction after the replacement
Economic justification
This particular plant makes between 35-45 cars an hour, depending on demand. When a drive fails, it totally stops production throughout the plant. When a failure occurs, the engineers have to locate which drive has failed and assess the extent of the failure. If it is a straightforward replacement then it could be minimal downtime as they have two 20-minute breaks per day. However, it is usually not this simple and can cause a significant delay to production. An unplanned stop caused by an equipment failure on the drive units to the assembly line would cause a loss of production of up to sixty cars per hour.
