
This case study comes from a paper plant in Java, Indonesia. Using HD ENV, we detected a bearing outer raceway defect with 20 months of pre-warning time, giving the client plenty of time to plan for the bearing change with full awareness of the extent of the fault.
On March 10, 2018, we detected an early anomaly on a bearing in Dryer 31. This was a 23036 bearing in a variable-speed machine, ranging from approximately 65 to 110 RPM.
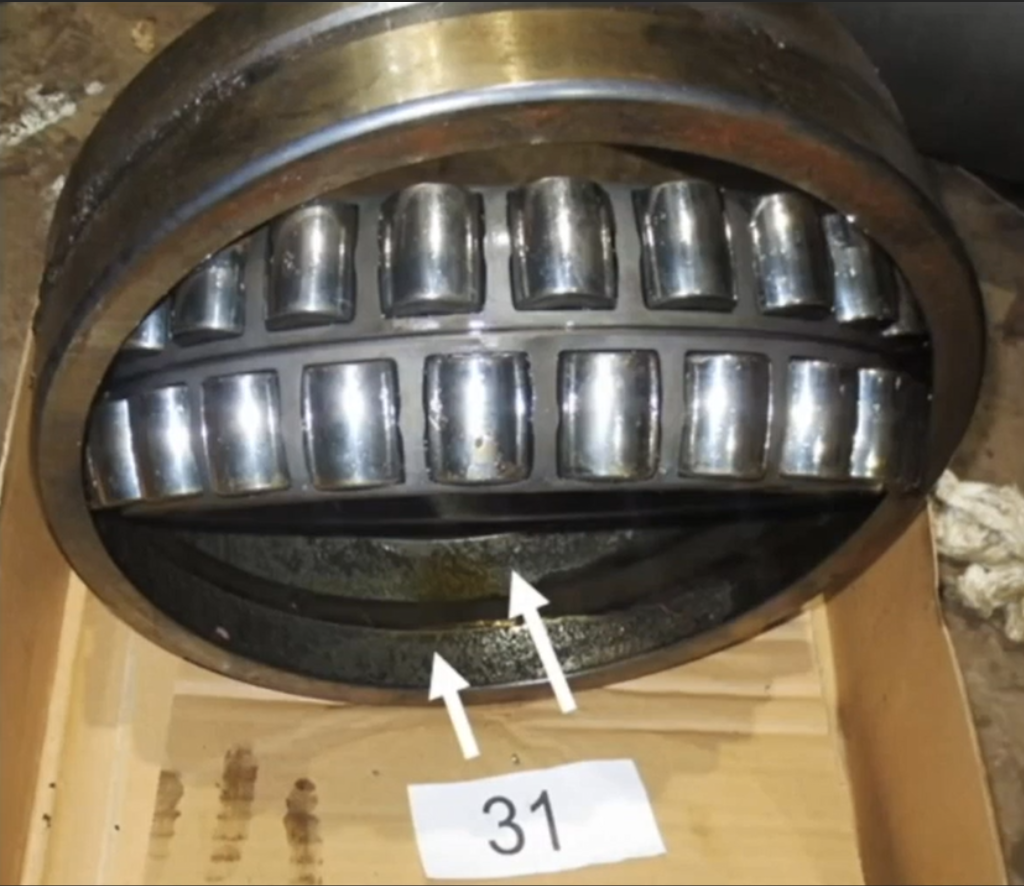
Figure 1: Bearing from Dryer 31
Figure 2 shows the trending graphs from February 2017 to February 2020 for various techniques: RPM + transducer line test, FFT standard, ENV standard, HD overall, and HD ENV with Filters 4, 3, 2, and 1. So you can see the difference there.
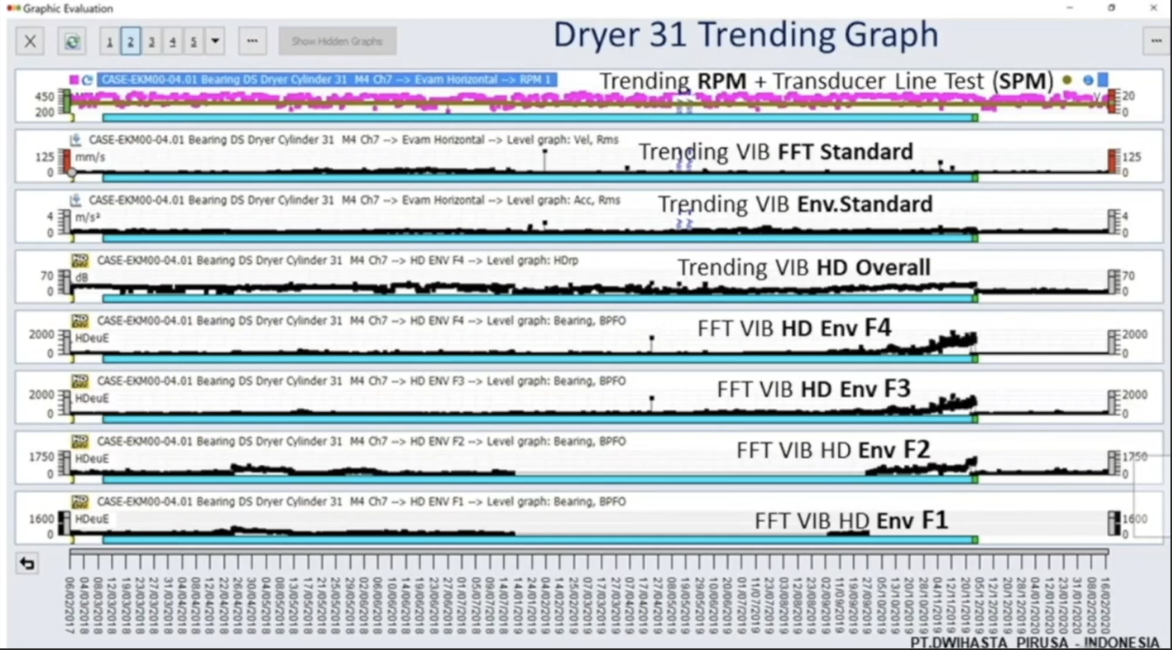
Figure 2: Dryer 31 trending graphs
During this period, the lowest speed on this variable speed machine was 66.7 and the highest was 107.9.

Figure 3: Trending RPM and vibration transducer line test
Figure 4 shows the vibration overall trending and FFT standard enveloping trending.
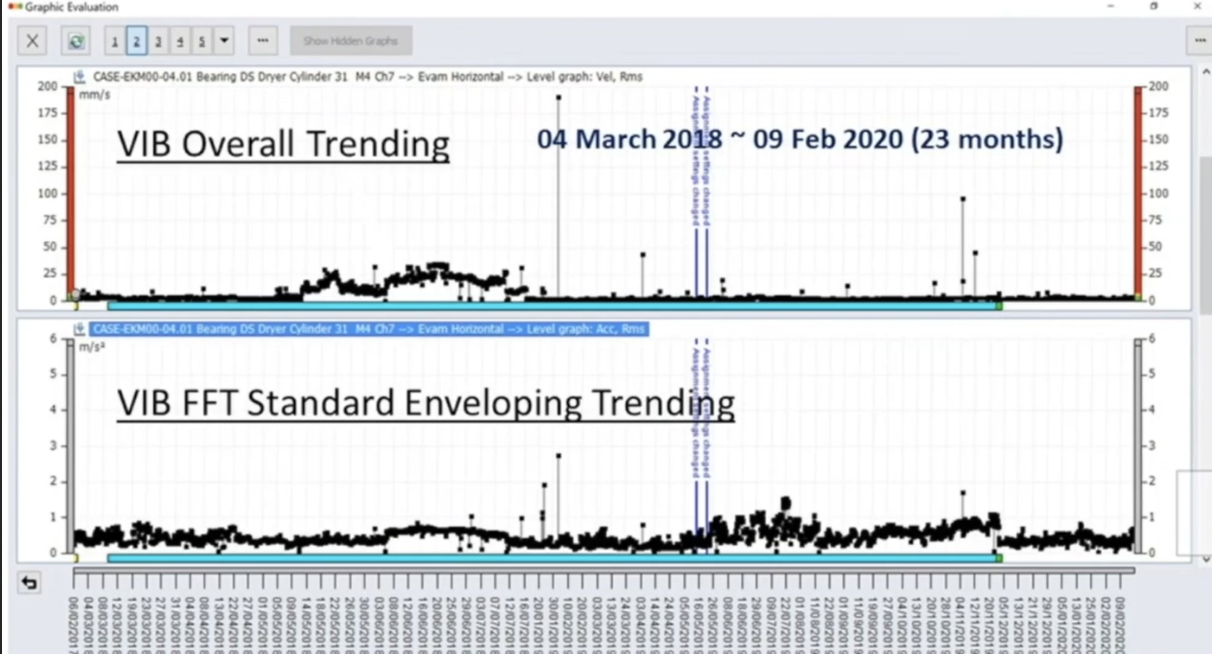
Figure 4: Vib overall and FFT standard
Figure 5 shows the standard enveloping trending. You can see when we detected the early abnormality on March 10, 2028, and the bearing performance until it was changed on November 24, 2019, and then a few months of the new bearing’s measurements.
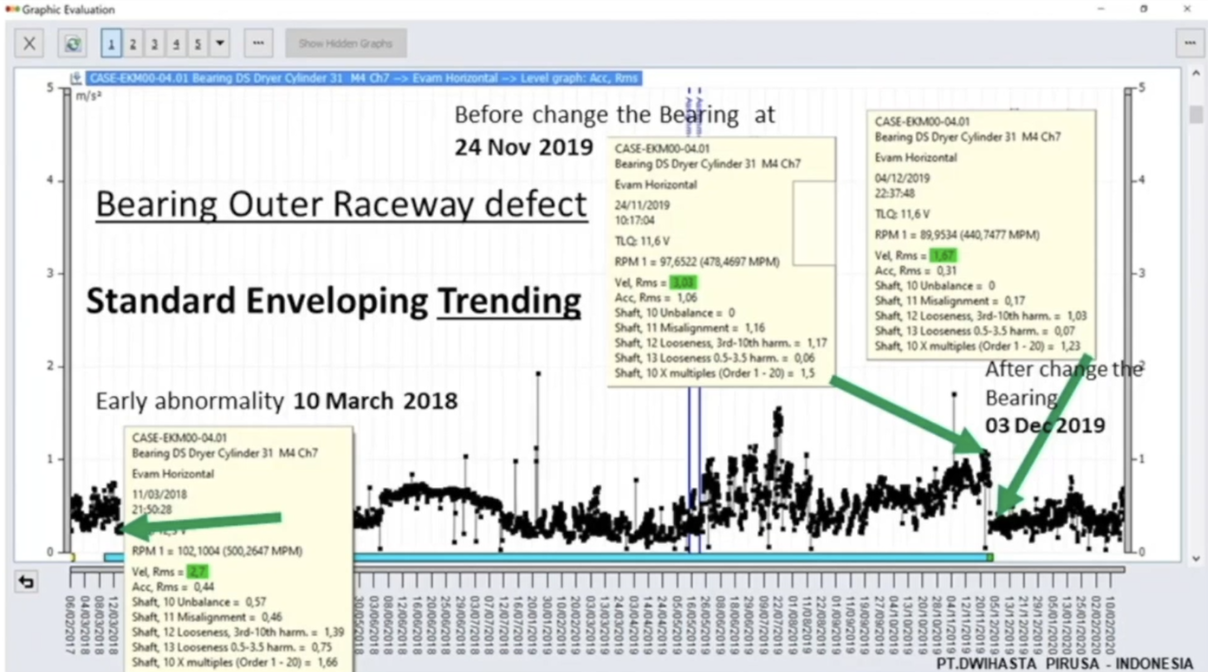
Figure 5: Standard enveloping trending
The RMS just before changing the bearing was 3.03, and it was 1.67 just after. Using this technique only, it would have been difficult to detect the fault.
It was much easier to detect the fault using HD ENV trending. In March 2018, the BPFO was 28.96. By November 2019, it had risen to 1,311.8. After the bearing was changed, the BPFO was 51.61.
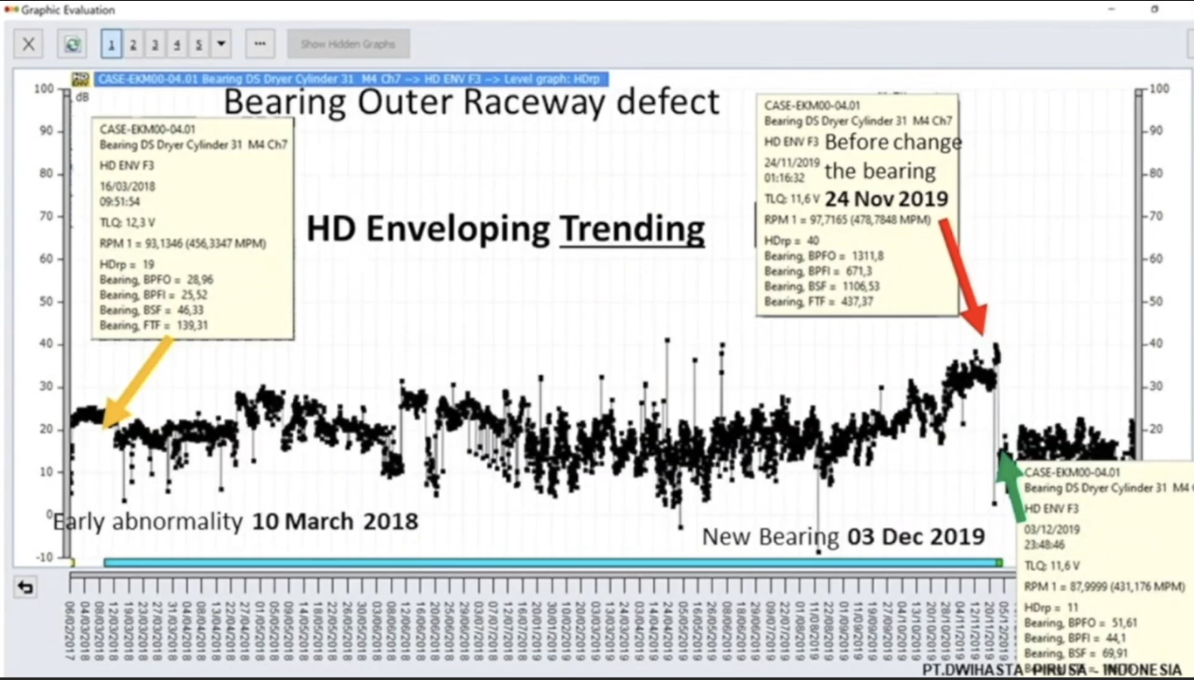
Figure 6: HD ENV trending
We used HD ENV with filters. Figure 7 shows the progression of bearing faults along with the filters that are used to detect them.
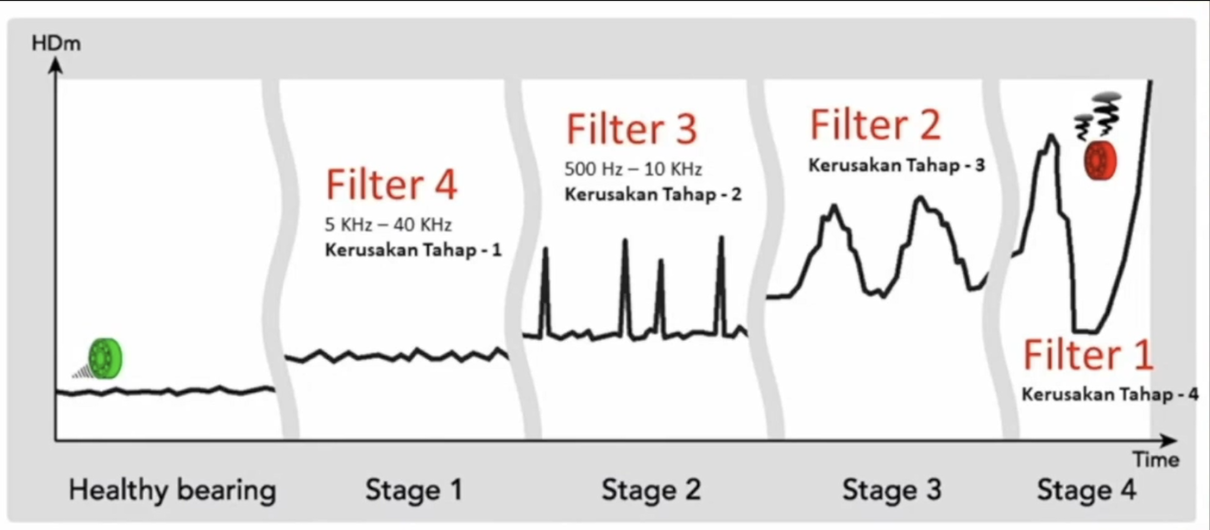
Figure 7: Filter types
Filter 4 can detect bearing faults as early as Stage 1. This may be a tiny scratch, so there is very little damage. Filter 3 detects a slightly higher degree of damage at Stage 2. Filter 2 detects Stage 3 damage. If you are using Filter 1, it is probably time to change the bearing because it is about to fail. This technology is very easy to use.
We were able to detect the early abnormality using Filter 4. The BPFO was 49, and it rose to 2,079 before the bearing was changed. After the bearing was changed, the new bearing showed a BPFO of 9.25.

Figure 8: HD ENV trending with Filter 4
Figure 9 shows the spectrums, time signals, and circle plots from the time of the early abnormality, just before the bearing was changed, and just after the bearing was changed.
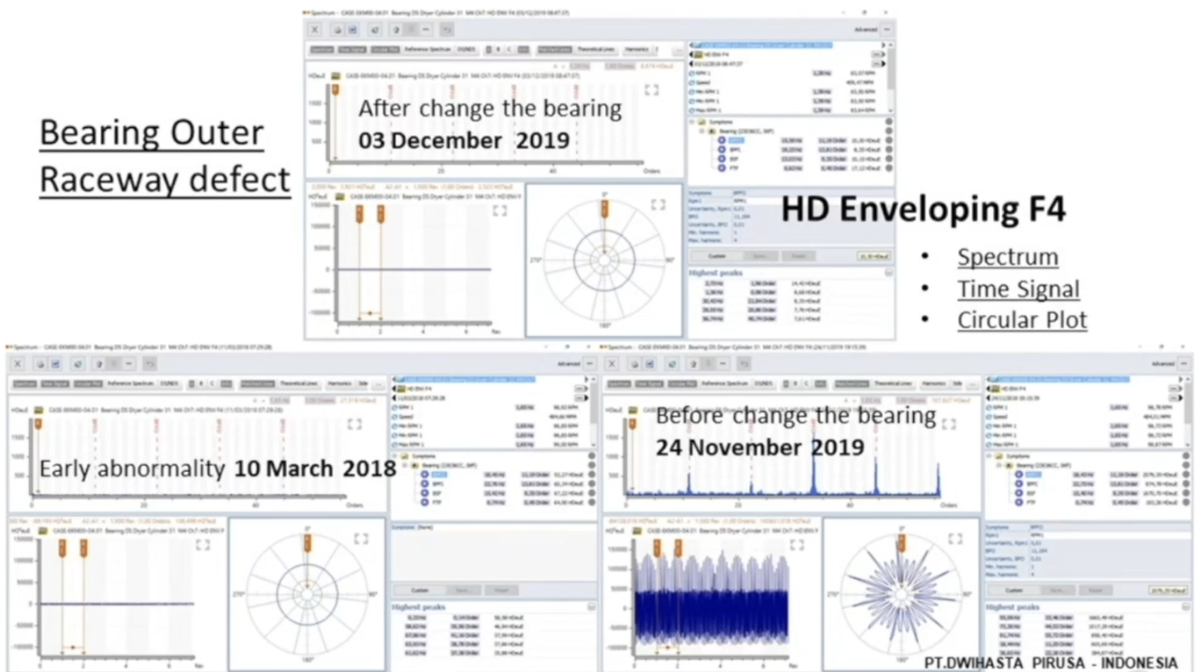
Figure 9: Spectrums, time signals, and circle plots from Filter 4
You can see that the circle plot from November 2019 has 11 peaks, as the BPFO was 11.28.
When using Filter 3, the BPFO measurements were 58.1, 1,850.75, and 30.83.
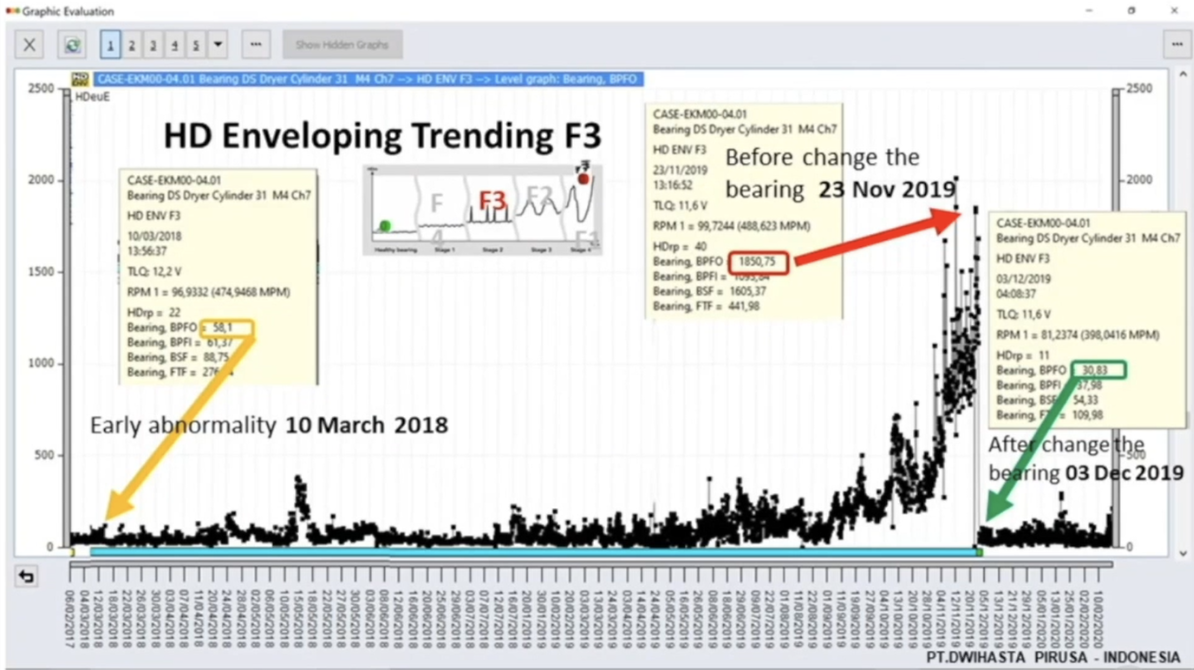
Figure 10: HD ENV trending with Filter 3

Figure 11: Spectrums, time signals, and circle plots from Filter 3
When using Filter 2, the BPFO measurements at from March 2018 and November 2019 were 204.8 and 1.683.83.
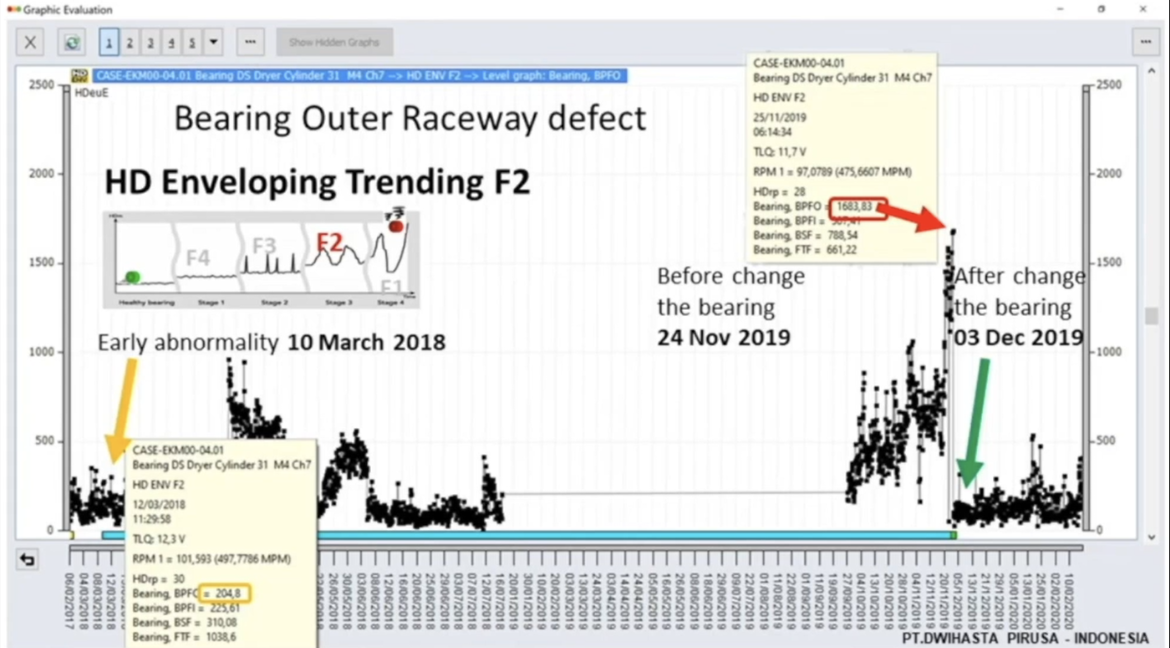
Figure 12: HD ENV trending with Filter 2

Figure 13: Spectrums, time signals, and circle plots from Filter 2
Not as much data was collected using Filter 1 because the measuring time takes longer. The BPFO was 152 on March 10, 2018, and 263.68 on September 27, 2019.
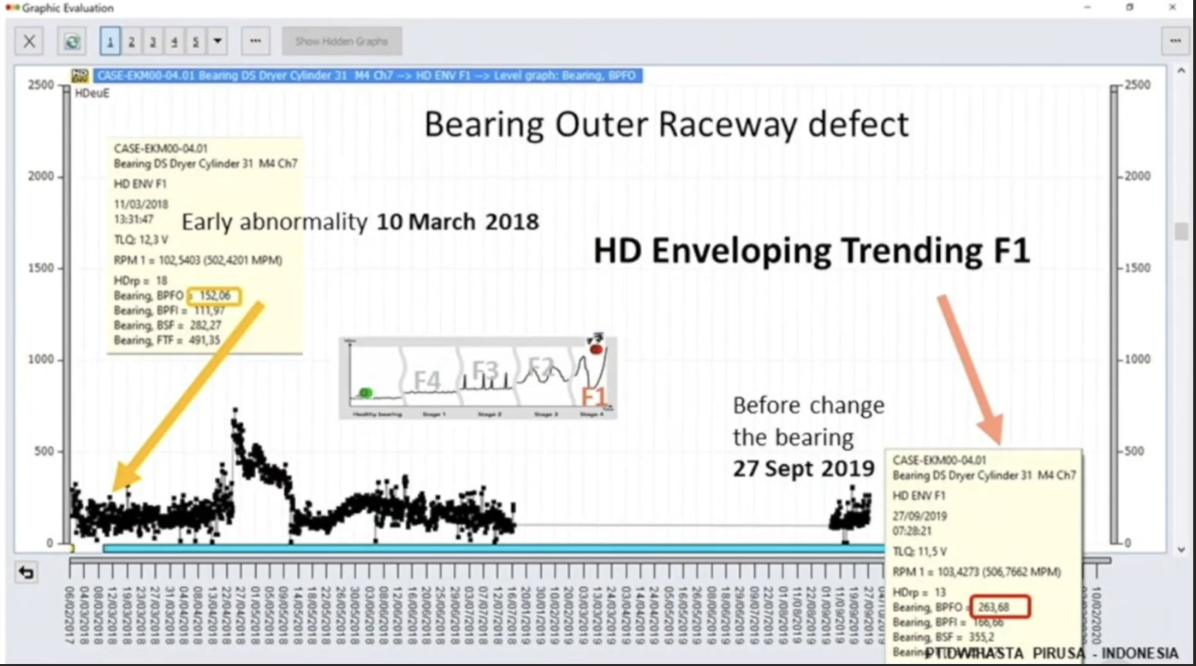
Figure 14: HD ENV trending with Filter 1
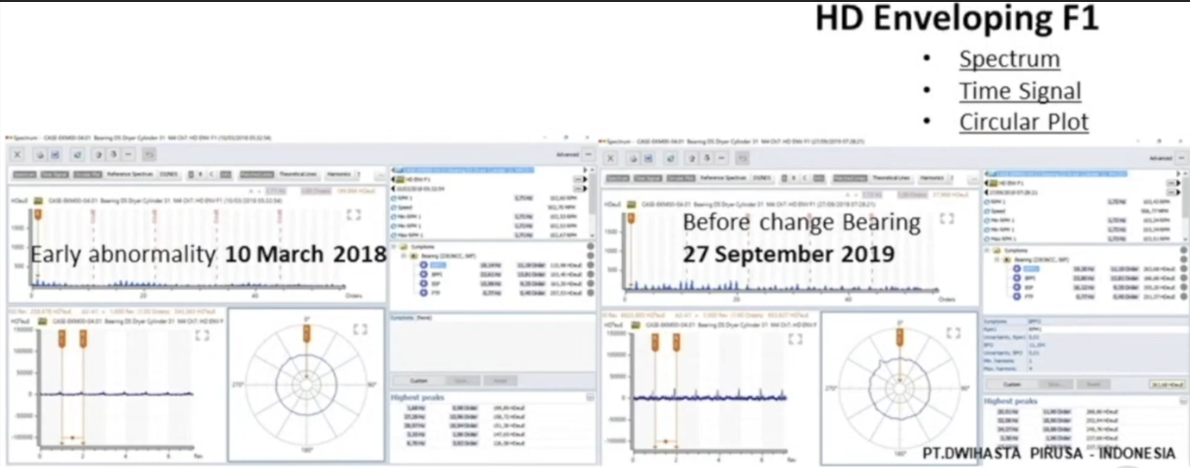
Figure 15: Spectrums, time signals, and circle plots from Filter 1
One objective of using HD ENV technology to measure machine faults is to save money. The P-F curve for this bearing shows that there was a 20-month pre-warning time before the bearing’s condition began to worsen more dramatically.
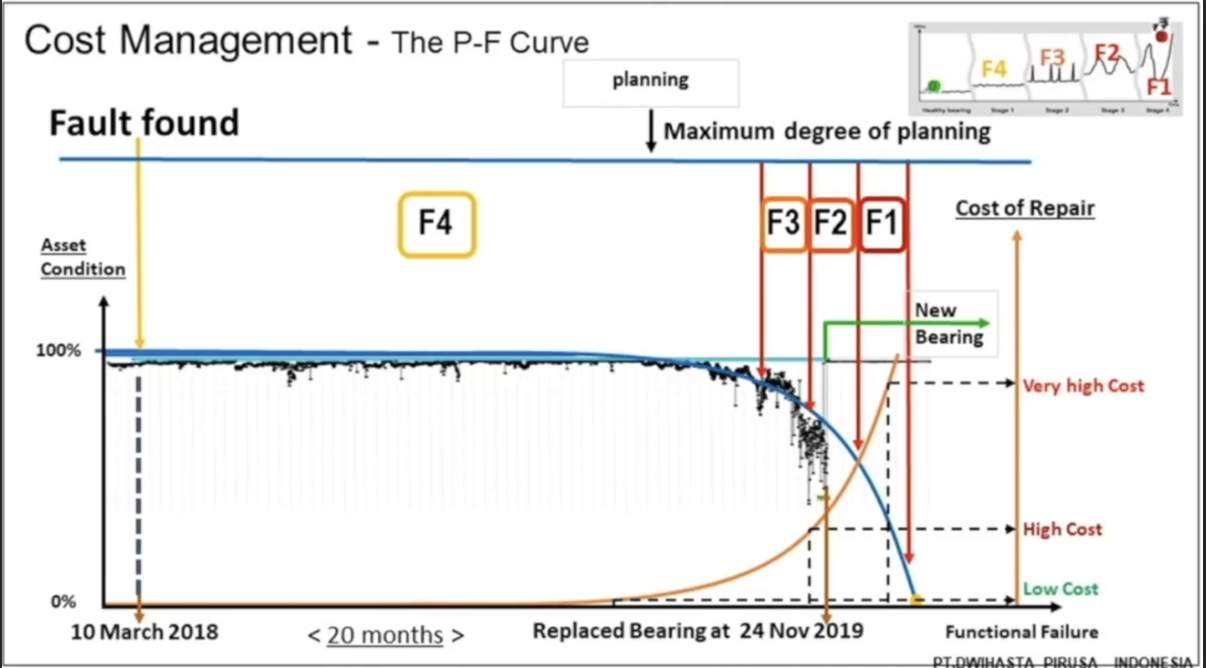
Figure 16: P-F Curve
When we detected the early anomaly, we knew that the bearing failure was at an early stage, and the bearing would run for a long time with maximum output. The bearing was in no danger of catastrophic failure; therefore, it did not need to be changed. There was still a lot of life in the bearing.
Regular monitoring during that time showed that the bearing’s progress toward failure was extremely slow, and the client could have full confidence that it would continue to perform for the near future.
This allowed them a long planning time to order the new bearing, which did not need to be installed until regular measurements showed the bearing’s condition was beginning to degrade more quickly. Because of the extended planning time, there was no downtime, which allowed the plant to achieve its goals.
