Conclusion and summary
At the time of writing, the Intellinova system at this plant has been in operation for four years with a 100% hit rate on all bearing damages, enabling the customer to plan bearing replacements well ahead.
The results with the DuoTech accelerometer are beyond all expectations. The performance on SPM HD measurements in terms of noise immunity as well as the sensitivity in detecting bearing defects in its earliest stages are excellent, demonstrating the ability of DuoTech accelerometers to be used successfully in this ultra-low speed range of 3.5 RPM.
Looking at the results from HD ENV measurements, we see similar results between HDENV4 and SPM HD, whereas HDENV3 very clearly shows bearing defects on outer as well as inner races.
This leads to the conclusion that HD condition monitoring technology and DuoTech accelerometers are capable of detecting bearing damages in their earliest stages and also of tracking the damage development process over time. This condition monitoring solution is a useful tool for the customer, enabling the planning of bearing replacements more accurately and timely, without the risk of neither premature nor overdue replacement. Other advantages are the crystal clear time waveforms and spectra with a low noise floor, enabling the use of bearing condition evaluation on a standard green-yellow-red scale – an easy-to-use interface for the customer. The last case shows the added value of the SPM method monitoring lubrication condition.
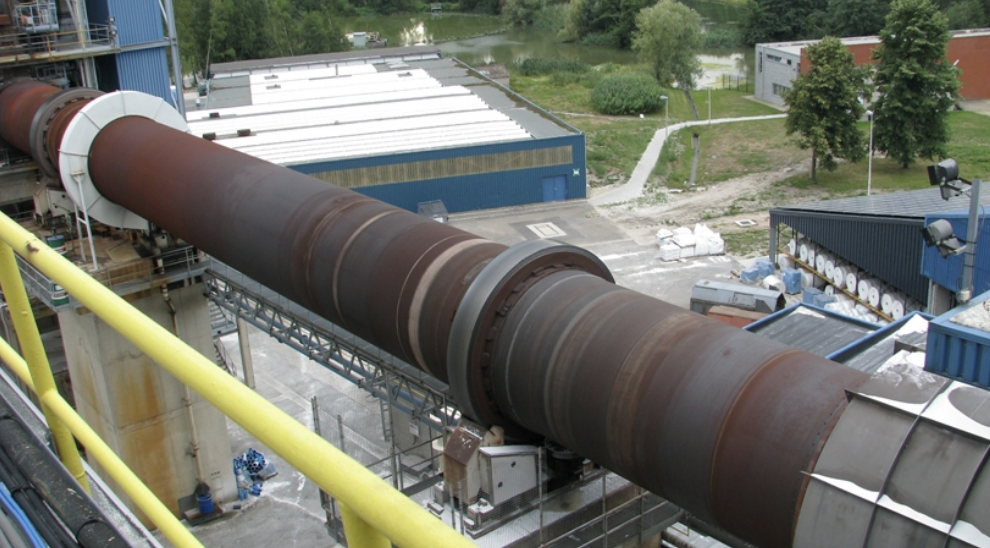
Image 1. The rotary calciner.
Application description
Quartz sand from wet mining is pumped to the first part of the factory through various dredging boats, using sand pumps. The first classification of the quartz sand is done using hydrosizers. Next, the sand is pumped to silos, from which water is extracted via a drainage system. After this process, the quartz sand contains 5% water. This sand can be sold to customers in bulk. 80% dry sand is used in two processes: calcination and drying/milling. For the milling process, ball mills are used.
The calcination process consists of adding additives and heating to 1500 degrees in a tumbling dryer (calciner) in order to change the structure of the sand/quartz crystal (similar to the popping of maize grain). The transit time of the quartz sand in the calciner is approximately two hours, with a drum speed of 1.15 RPM. The end product is cristobalite. The capacity of the calciner is 20 tons/hour. The heating up/cooling down of the calciner takes at least 48 hours. The fuel is a mixture of natural gas and heating oil.
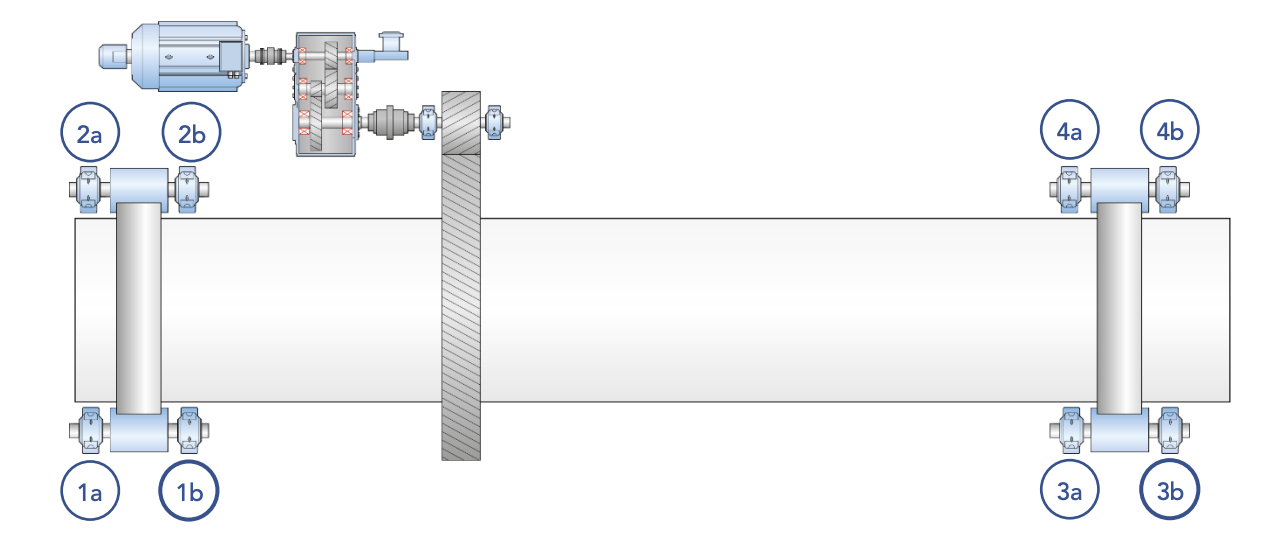
Fig 1. The mechanical construction of the calciner. This case study involves damages detected on bearings 1b and 3b, respectively, and also shows a lubrication problem in the fan bearings.
Background
In 2013, we first started discussions to apply SPM Instrument’s HD technology on the support wheel bearings of the calciner drum, which is a low-speed (3.5 RPM) application. Until then, a vibration monitoring system had been in place for nearly a decade. Based on traditional vibration analysis techniques, this system yielded very short pre-warning times and identifying any presence of bearing defects was very challenging.
In September 2013, a test installation was set up to demonstrate the capabilities of the SPM HD measuring technique and to determine its ability to detect bearing damages with longer pre-warning times. The system immediately identified a bearing defect on an outer race in one of the support wheel bearings. The subsequent bearing replacement was a correct decision with adequate prewarning time (see Case #1). Based on these test measurement results, a permanent monitoring system was installed in the first half of 2014.
One of the findings in the SPM HD measurements was the presence of high noise floors, fluctuating over time, with support wheels no. 3 and 4 being more severe. The ambient noise is attributed to the drivetrain power cables, and the use of coaxial cabling with the type 44000 shock pulse transducers.
During 2017, a new transducer type was tested: the DuoTech accelerometer, combining an accelerometer and shock pulse transducer in a single housing. Until then, there were no cases where this transducer had proven successful at 3.5 RPM. In addition, DuoTech uses two-wire shielded cabling and an isolated housing, providing better immunity to ambient noise and interference.
The customer also expressed their wishes to be able to follow up on bearing damage development over time and to have a better tool in place for the planning of bearing replacements. For that reason, the HD ENV measuring technique was tested as well.
In this case study, a number of cases are described. Cases no. 2 and 3 are examples of bearing damages using HD technology and DuoTech accelerometers.
System setup
Measuring equipment
An Intellinova Compact INS18 unit is installed, consisting of twelve shock pulse channels and six vibration channels. Type 44000 shock pulse transducers are mounted on the support wheel bearings, pinion shaft bearings, and gearbox output shaft bearings. Existing accelerometers, which were already in place, are used for measurement on the motor and gearbox.
Measuring technique(s)
With the initial setup of the system, SPM HD was used for the low-RPM part, i.e. the support wheel bearings, support bearing of the pinion wheel driving the calciner drum, and the gearbox output shaft bearings. For normal speed motor/gearbox bearings, traditional vibration and enveloping was used.
In March 2017, the HD ENV measuring technique was applied on DuoTech accelerometers that were installed for testing purposes.
Condmaster
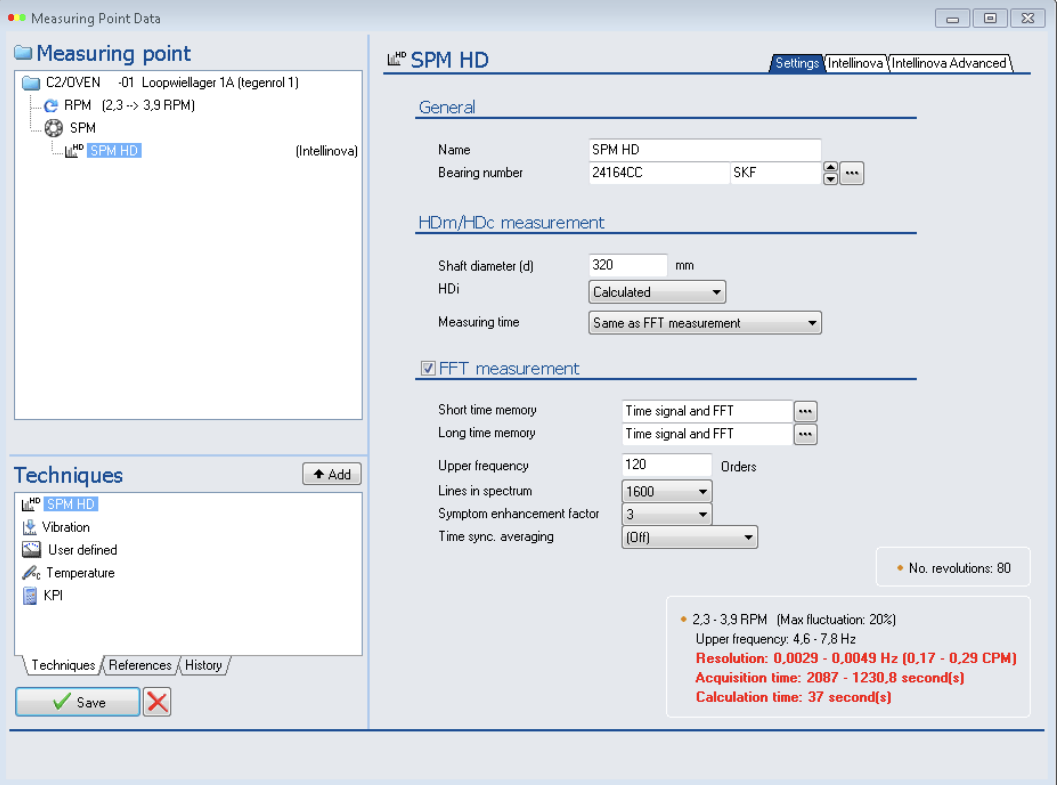
The setup The setup in Condmaster for the support wheel bearings was straightforward. Considering the ultralow RPM – around 3.5 RPM on average – the Symptom enhancement factor (SEF) could only be set to 3. Fmax is 120 orders, and the resolution 1600 lines. Measurements were taken every four hours, and no measurement conditions or filtering were applied.
Fig 2. Condmaster setup
Case descriptions
Case #1: Outer race damage – Bearing 3B with SPM HD
Fig 3. SPM HD trend graph of outer race defect frequency, and a frequency spectrum (FFT) with markers on BPFO.
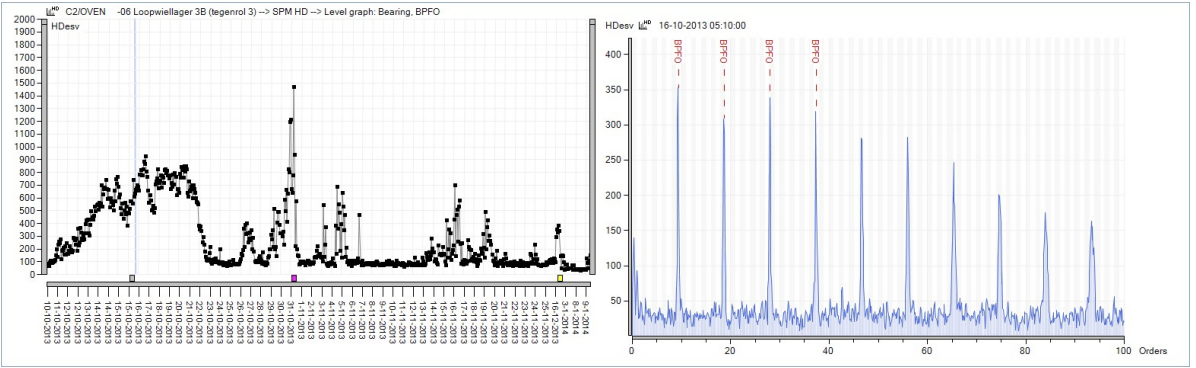
Fig 4. SPM HD Color Spectrum Overview showing increasing amplitude for BPFO, and the spalling process. At the end of October, a short strong increase in BPFO can be noticed.
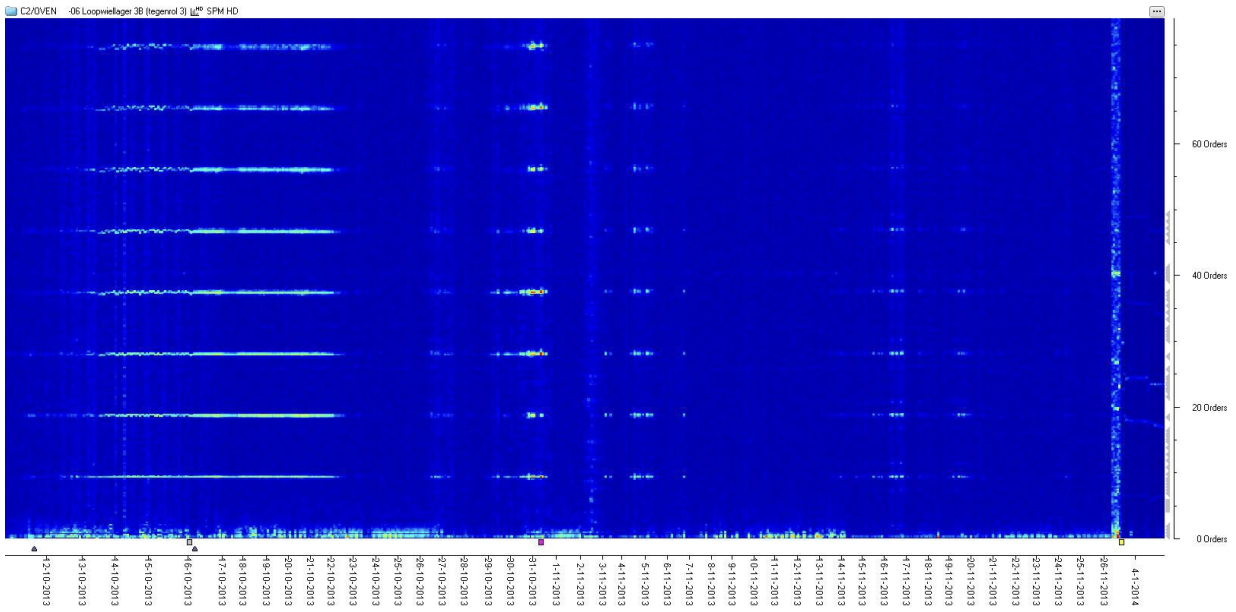
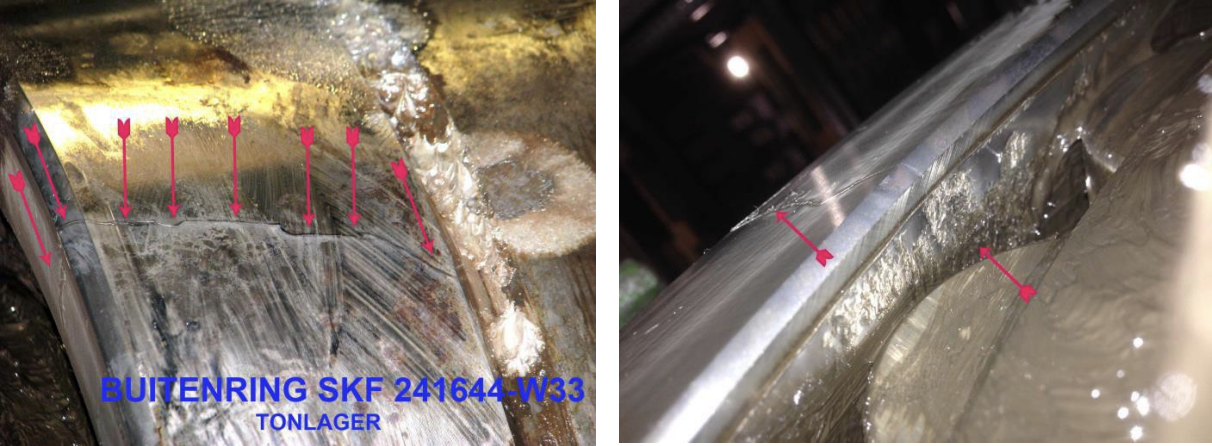
Image 2. Photos of bearing 3B showing the damaged outer race. The bearings were replaced in the beginning of January, 2014.
Case #2: Outer race damage – Bearing 1B with DuoTech/HD ENV
Fig 5. SPM HD measurement with DuoTech starting March 14, 2017. SPM HD measurements taken with 44000 transducers already detected the first signs of outer race defects in June, 2016, providing over ten months pre-warning time.
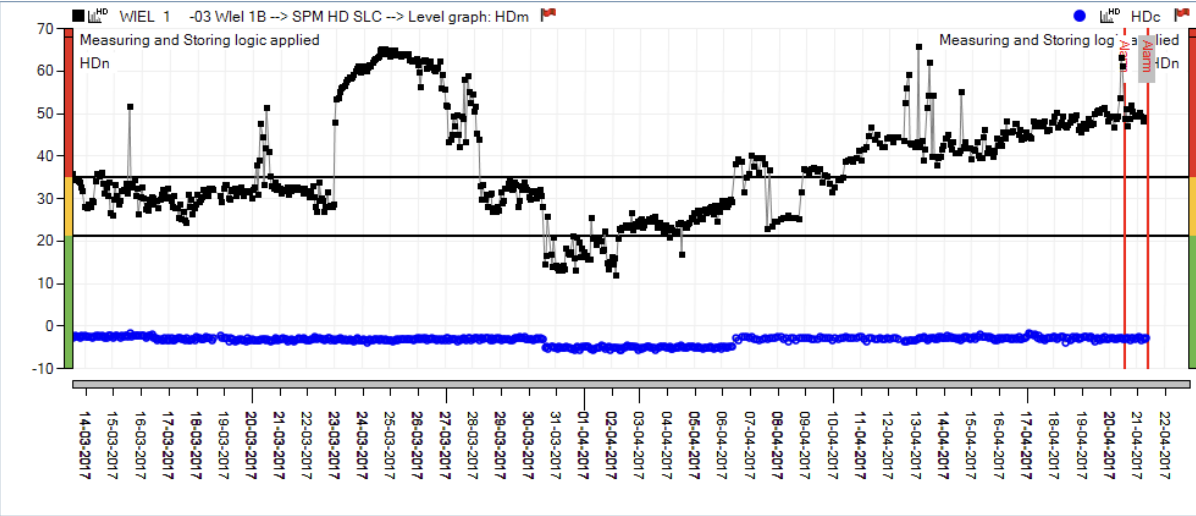
Fig 6. BPFO trend graph and FFT. Notice the low noise floor in the FFT

Fig 7. The spalling process is clearly visible in the Color Spectrum Overview
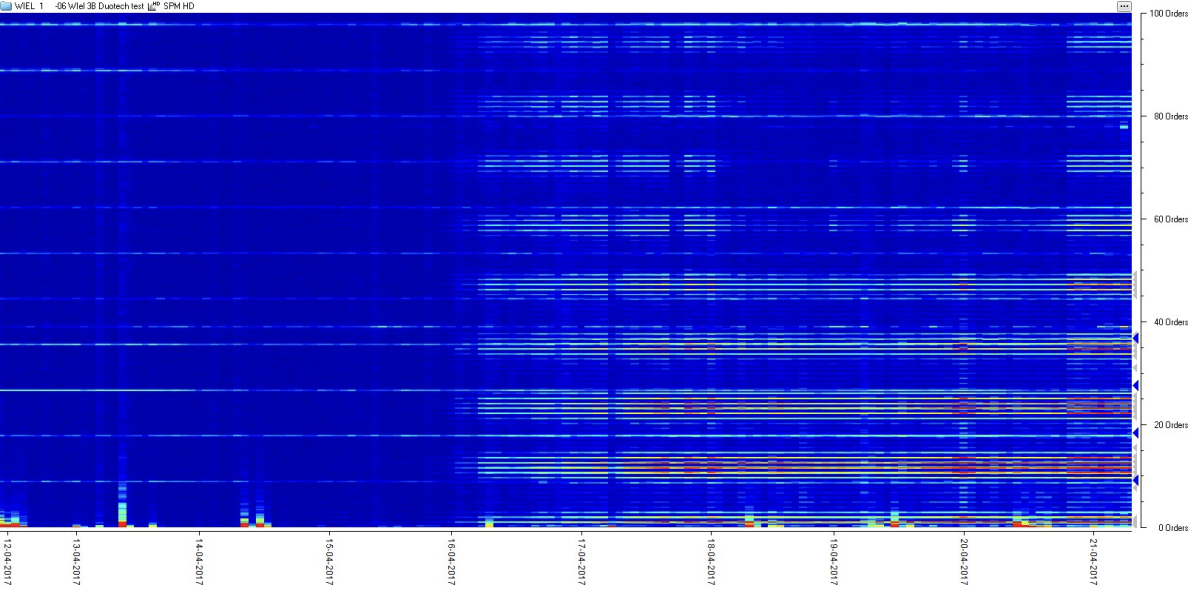
Fig 8. Around April 5, 2017, HD ENV measurements were added, showing clear signs of outer race bearing wear
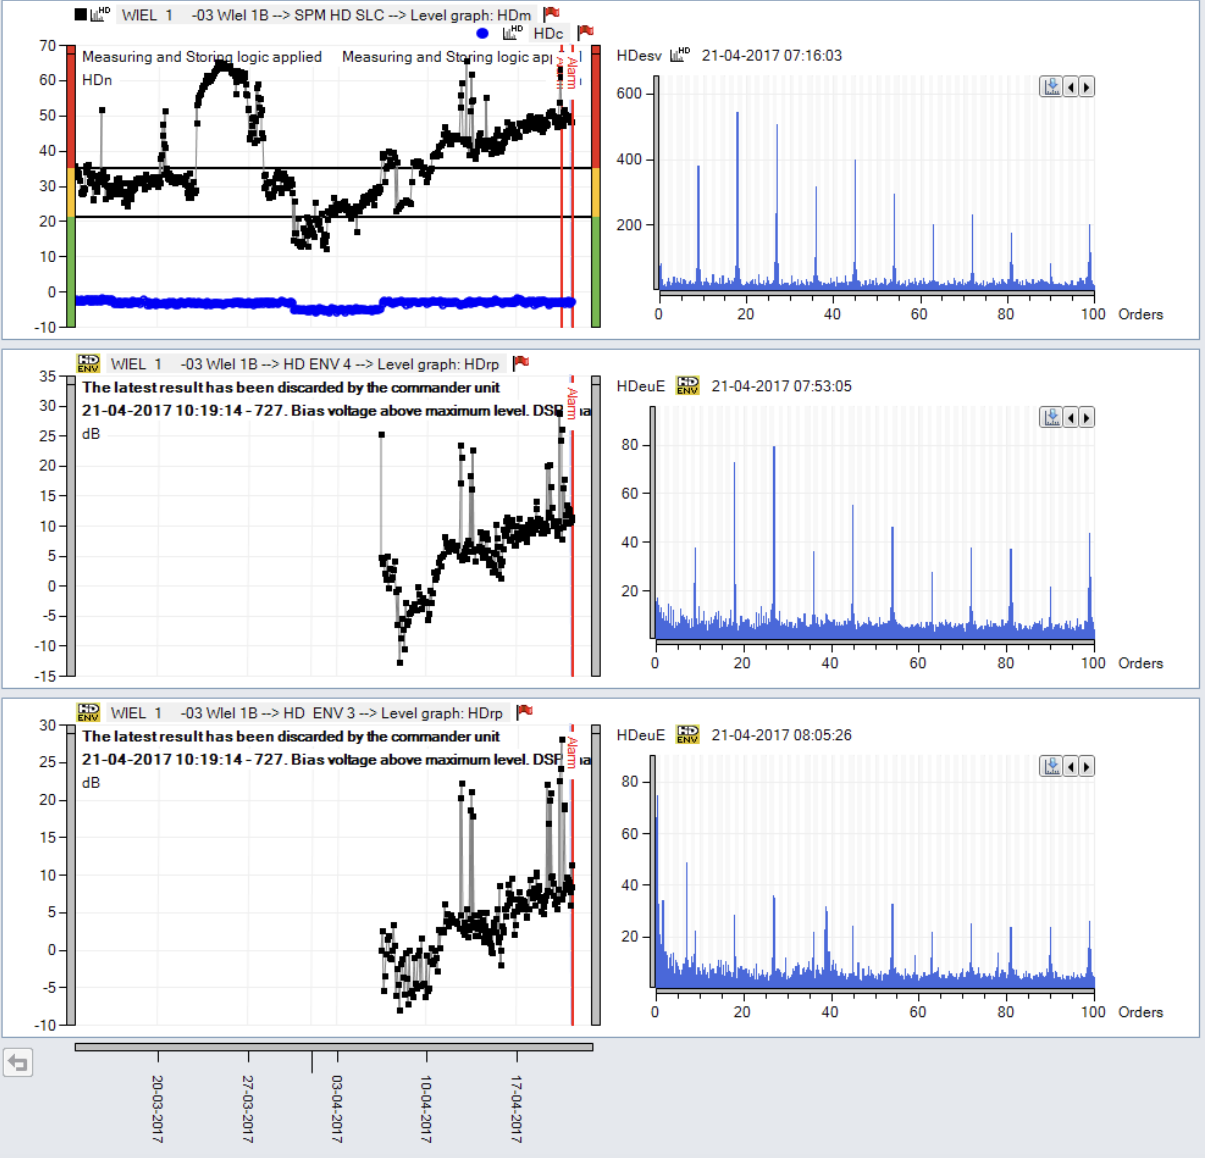
Image 3. Photos of bearing 1B taken after bearing replacement.

Case #3: Outer/inner race damage – Bearing 3B with DuoTech/HD ENV
Fig 9. SPM HD measurement with DuoTech, starting on April 12, 2017. SPM HD measurements taken with 44000 transducers already detected the first signs of outer race defects in July, 2016, providing over nine months pre-warning time. In the SPM HD trend graph below, HDm was already elevated due to the presence of an outer race defect. HDc does not show any signs of electrical interference.
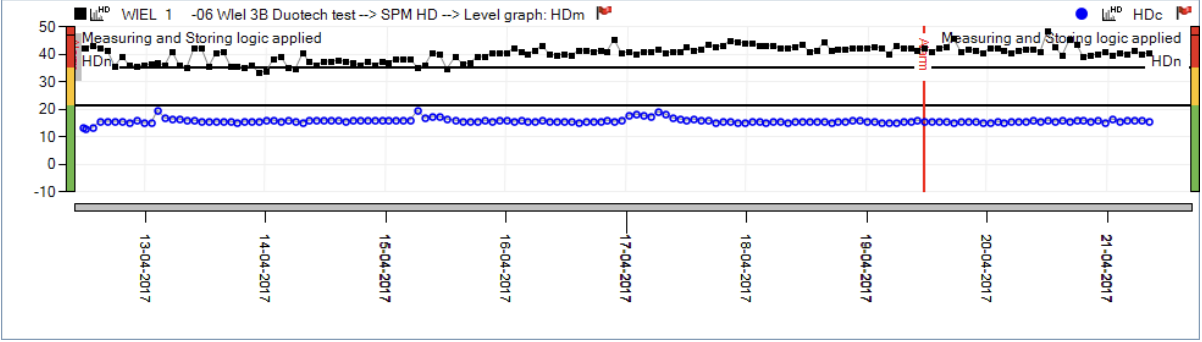
Fig 10. The BPFI trend graph starts to show increasing levels in mid April. BPFI is marked in the FFT. Strong sidebands can be observed.
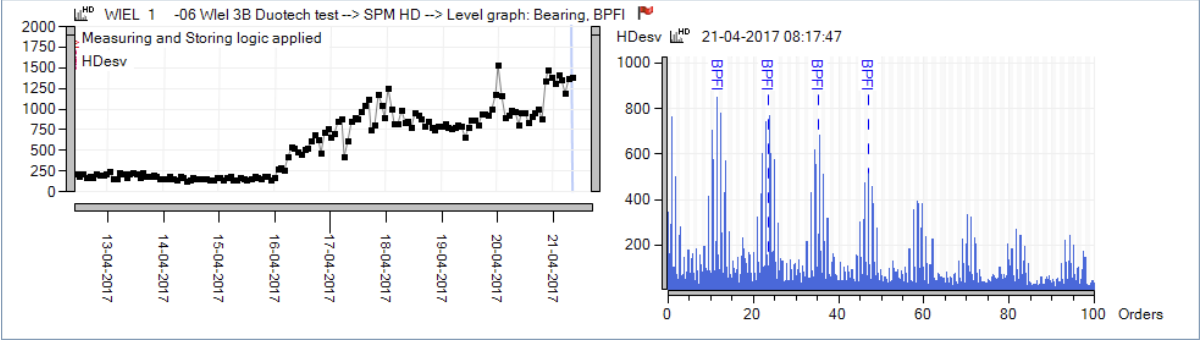
Fig11. The outer race defect is present from the start. The sudden strong increase of the inner race defect frequency, including harmonics and sidebands is clearly visible in the Color Spectrum Overview.

Fig 12. The inner race defect is effectively picked up with HD ENV Filters 4 and 3

Fig 13. The Color Spectrum Overview looks similar to that of SPM HD. It is very clean, indicating a low noise floor and confirming the ability of DuoTech to be used in environments with strong electrical interference.
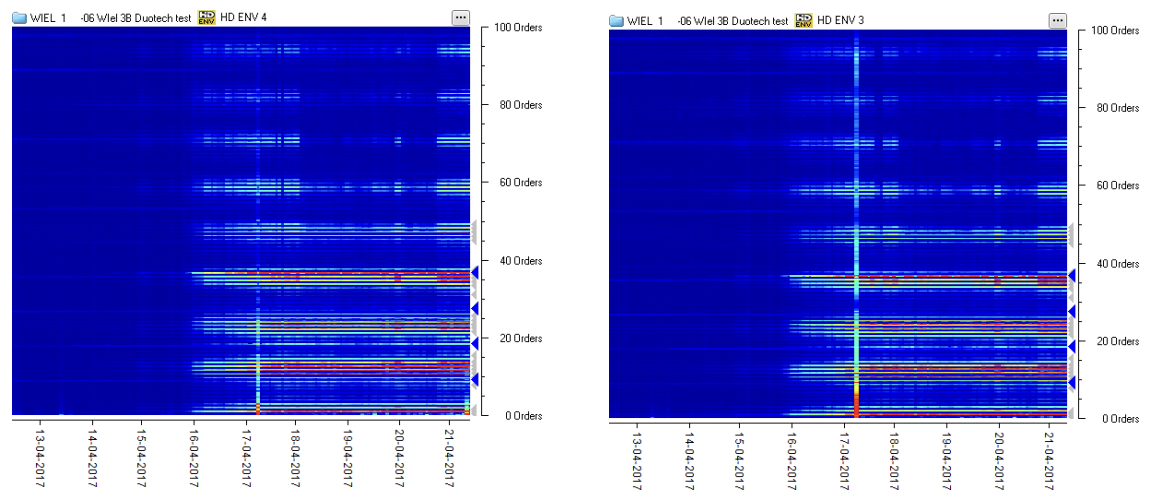
Image 4. Photos showing severe – Stage 4 – inner race and outer race damage

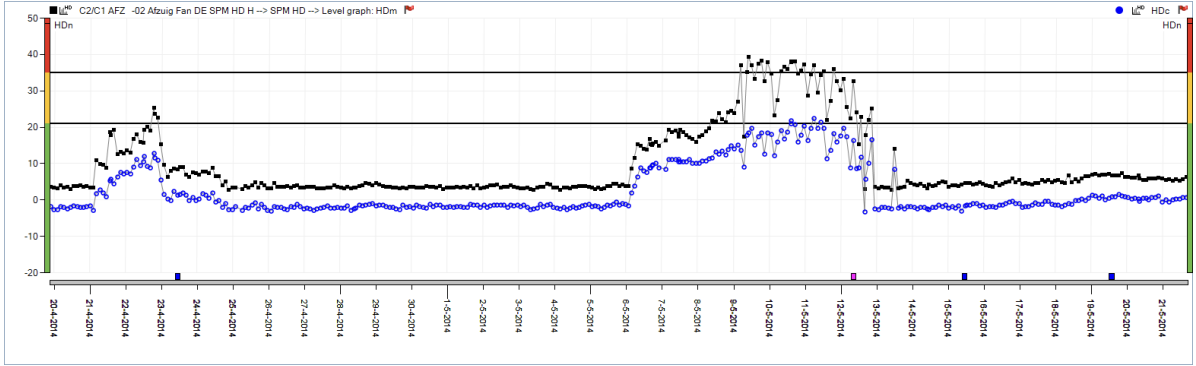
Case #4: Lack of lubrication in fan bearings
Fig 14. SPM HD measurement showing increasing HDm/HDc levels. The squares at the bottom of the trend graph indicate the dates when the bearing was lubricated.